Documentation and Help
Bioplex 2.0 Background
Architecture of the human interactome defines protein communities and disease networks:
The physiology of a cell can be viewed as the product of thousands of proteins acting in concert to shape the cellular response. Coordination is achieved in part through networks of protein-protein interactions that assemble functionally related proteins into complexes, organelles, and signal transduction pathways. Understanding the architecture of the human proteome has the potential to inform cellular, structural, and evolutionary mechanisms and is critical to elucidating how genome variation contributes to disease.
Here we present BioPlex 2.0 (Biophysical Interactions of ORFeome-derived complexes), which uses robust affinity purification-mass spectrometry methodology to elucidate protein interaction networks and co-complexes nucleated by more than 25% of protein-coding genes from the human genome, and constitutes, to our knowledge, the largest such network so far. With more than 56,000 candidate interactions, BioPlex 2.0 contains more than 29,000 previously unknown co-associations and provides functional insights into hundreds of poorly characterized proteins while enhancing network-based analyses of domain associations, subcellular localization, and co-complex formation.
Unsupervised Markov clustering of interacting proteins identified more than 1,300 protein communities representing diverse cellular activities. Genes essential for cell fitness are enriched within 53 communities representing central cellular functions. Moreover, we identified 442 communities associated with more than 2,000 disease annotations, placing numerous candidate disease genes into a cellular framework. BioPlex 2.0 exceeds previous experimentally derived interaction networks in depth and breadth, and will be a valuable resource for exploring the biology of incompletely characterized proteins and for elucidating larger-scale patterns of proteome organization.
Please Cite:
Latest BioPlex Manuscript: Huttlin et. al. Nature (2017)
BioPlexDisplay Manuscript: Schweppe et. al. JPR (2018)
Contact Information
The BioPlex Display website was developed by Devin K. Schweppe, Edward L. Huttlin, J. Wade Harper and Steve P. Gygi.For questions pertaining to the website please email Devin K Schweppe at:
devin_schweppe at hms dot harvard dot edu
(bolded portions should be symbols).
For other comments or questions, please see the Links and People pages for more information.
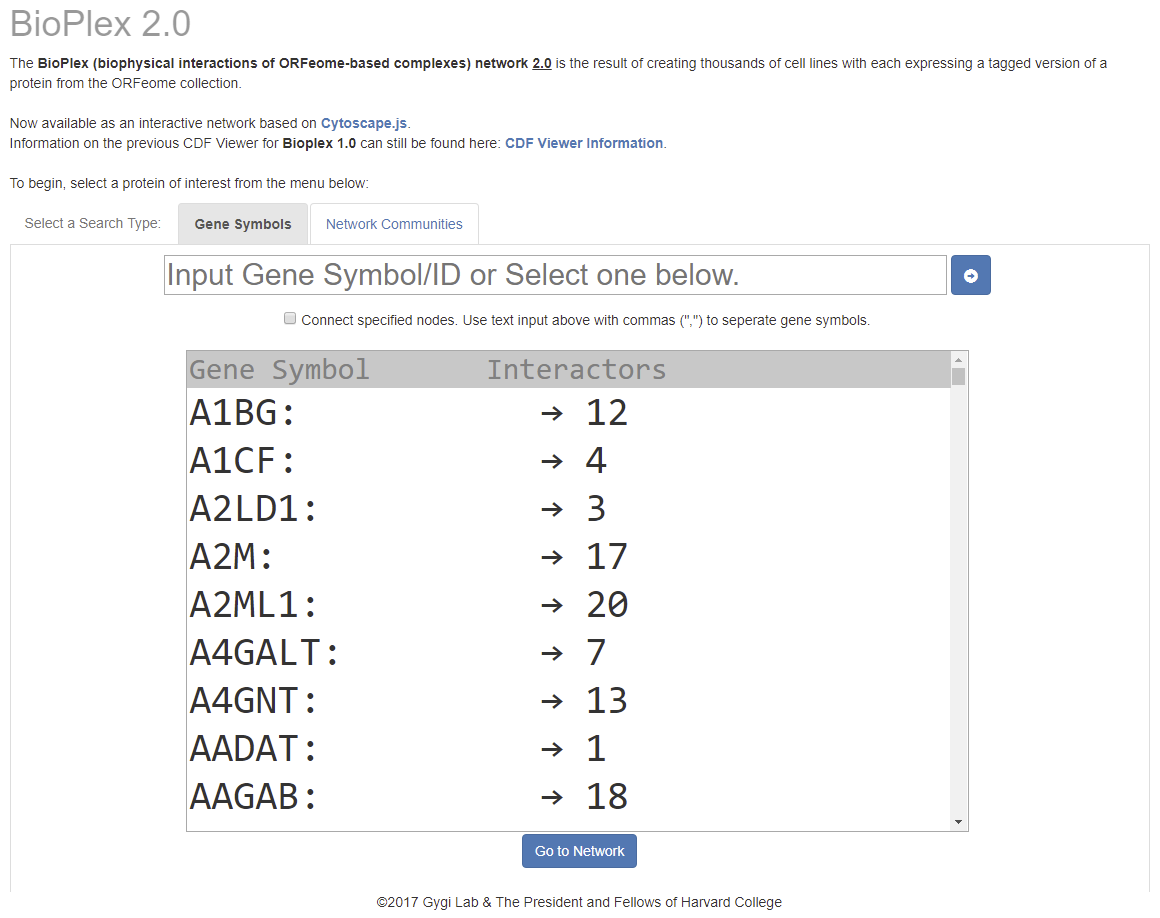
Search for a single protein
Proteins of interest can be searched from the home page by either:- Searching for proteins contained in the Bioplex Network, or
- Selecting proteins from the Bioplex network.
See image below for more information. Note, when selecting nodes from the list in the image below, that the number of nodes observed in interactions are displayed for each selection.
Search for multiple proteins
Multiple proteins can be searched at once using comma-delimited strings.Examples
Mitotic Spindle Kinases and Phosphatases: AurkA,Plk1,Pak7,PPP6R2
Mitochondrial Respiratory Complex I: NDUFA1,NDUFA2,NDUFS3,NDUFA5,NDUFS6,NDUFA13,NDUFS6,NDUFB11
14-3-3 Proteins: YWHAB,YWHAE,YWHAG,YWHAH,YWHAQ,YWHAZ,CGN,CDC25A,SPATA13,EPB49,STAC
External Queries of Protein Interactions Networks
Proteins of interest can also be queries externally using the following link:bioplex.hms.harvard.edu/bioplexDisplay/externalQuery.php?geneQuery=<geneID>
Where <geneID> should be a gene ID number for the protein of interest.Examples:
Bin3: bioplex.hms.harvard.edu/bioplexDisplay/externalQuery.php?geneQuery=55909
EGFR: bioplex.hms.harvard.edu/bioplexDisplay/externalQuery.php?geneQuery=1956
Access data through the BioPlex API
Interactions can be queried through an API for access to the protein-protein interaction data underlying the BioPlex Display site. Data can be exported as either JSON arrays (default) or tab-seperated flat files (.txt).The API will not export queries larger than 25000 rows. If you need the full dataset, please download that here.
Potential query parameters:
geneQuery - Query all interactions involving a specific geneID.pintLow - Low probability of interaction filter. Interactions with probability of interaction greater than or equal to this value will be extracted.
pintHigh - High probability of interaction filter. Interactions with probability of interaction less than or equal to this value will be extracted.
interaction - Query BioPlex for a specific interaction (geneID-geneID).
Examples:
Bin3 Interactions (JSON Array):
http://bioplex.hms.harvard.edu/bioplexDisplay/api/api.php?geneQuery=55909
Bin3 Interactions (TXT):
http://bioplex.hms.harvard.edu/bioplexDisplay/api/api.php?geneQuery=55909&json=0
EGFR Interactions (JSON Array):
http://bioplex.hms.harvard.edu/bioplexDisplay/api/api.php?geneQuery=1956
EGFR Interactions (0.9 < pInt < 1, JSON Array):
http://bioplex.hms.harvard.edu/bioplexDisplay/api/api.php?geneQuery=1956&pintLow=0.9&pintHigh=1
EGFR-PTPRK Interaction (JSON Array):
http://bioplex.hms.harvard.edu/bioplexDisplay/api/api.php?interaction=1956-5796
Protein Community Query
BioPlex Display enables users to query protein communities from within the full interaction network.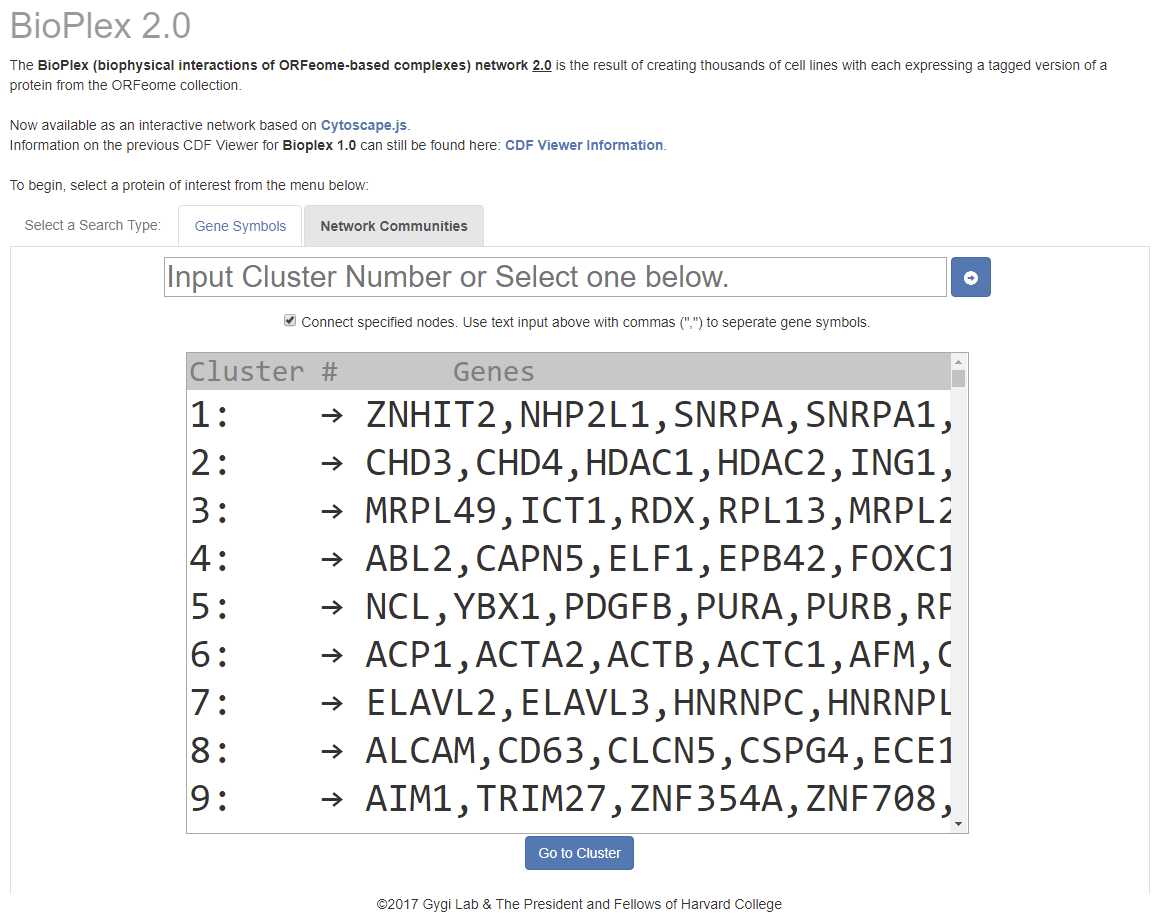
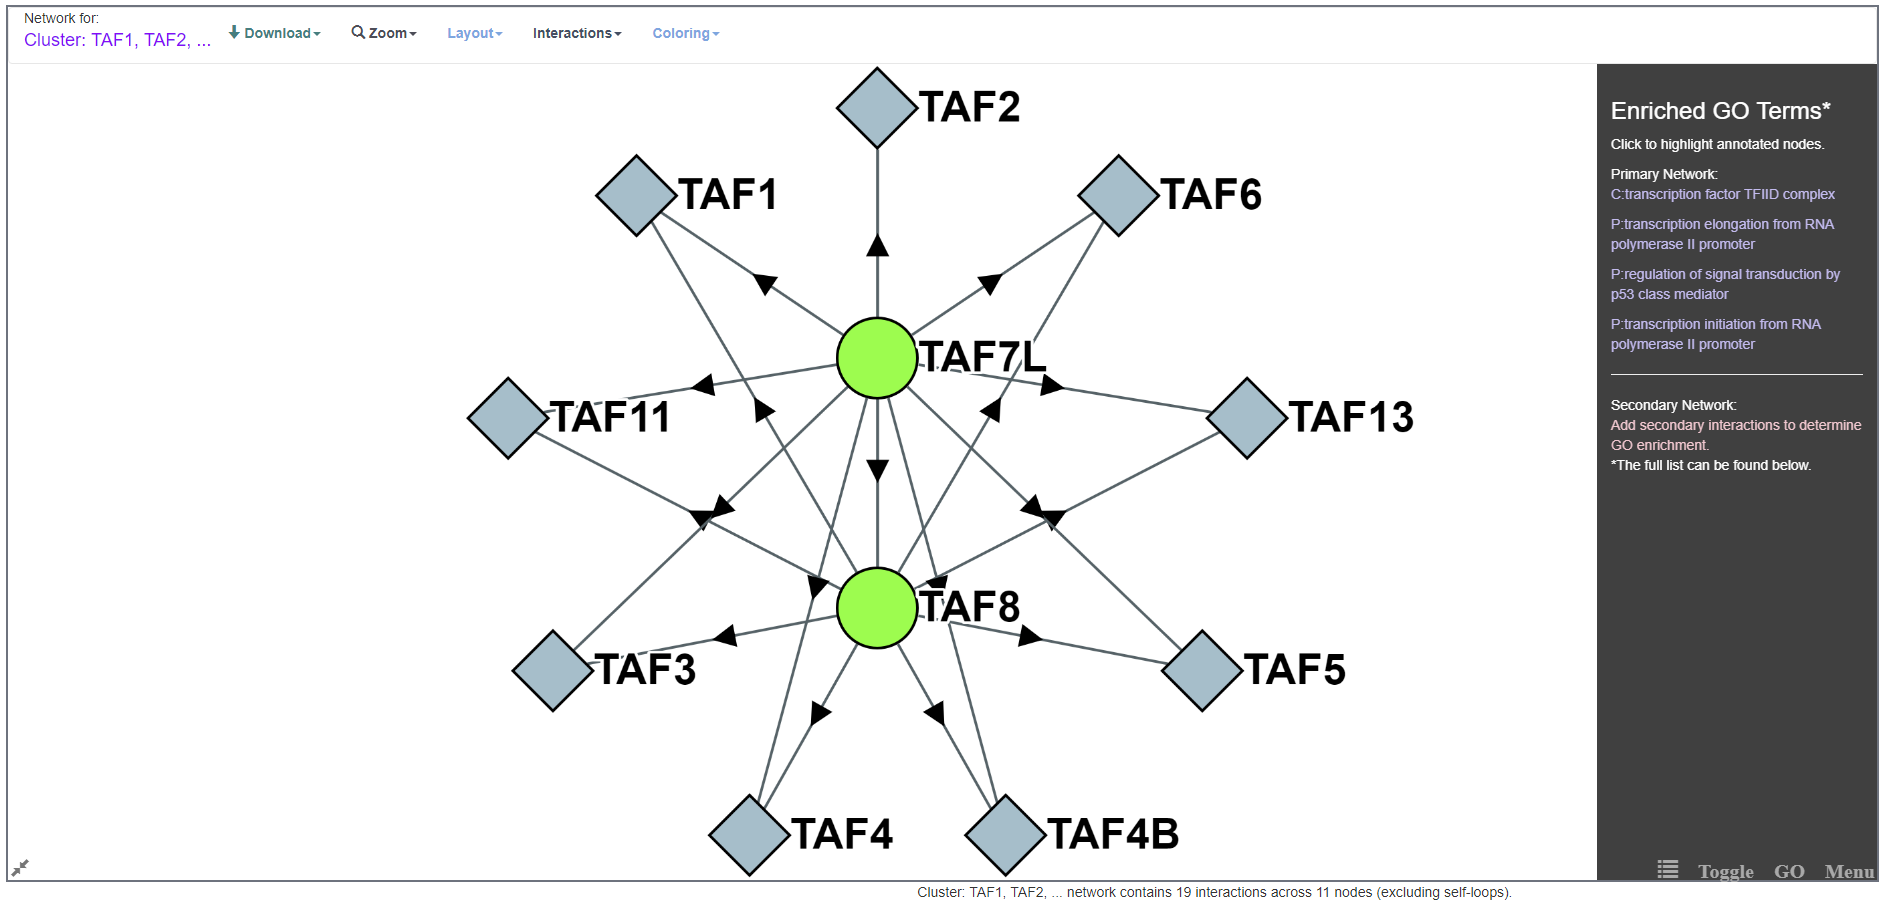
Protein Community Display
These tightly connected sub-networks represent specific protein complexes and protein pathway interactions. Furthermore, users are enabled to query proteins of interest against these communities from the Display homepage.Example of the community containing Taf2:
Network Toolbar
BioPlex sub-networks are displayed using Cytoscape.js. Within each display there are multiple options for exploring the BioPlex interactions with your protein interest. Nodes can be selected using CTRL+click-and-drag.- Core Network Display
- Interactions
- Network Search
- Layouts
- Coloring
- GO Annotation Enrichment
- GO Annotation Coloring
- Node and Edge Info.
- Zoom
- Export Data
- Interaction Table
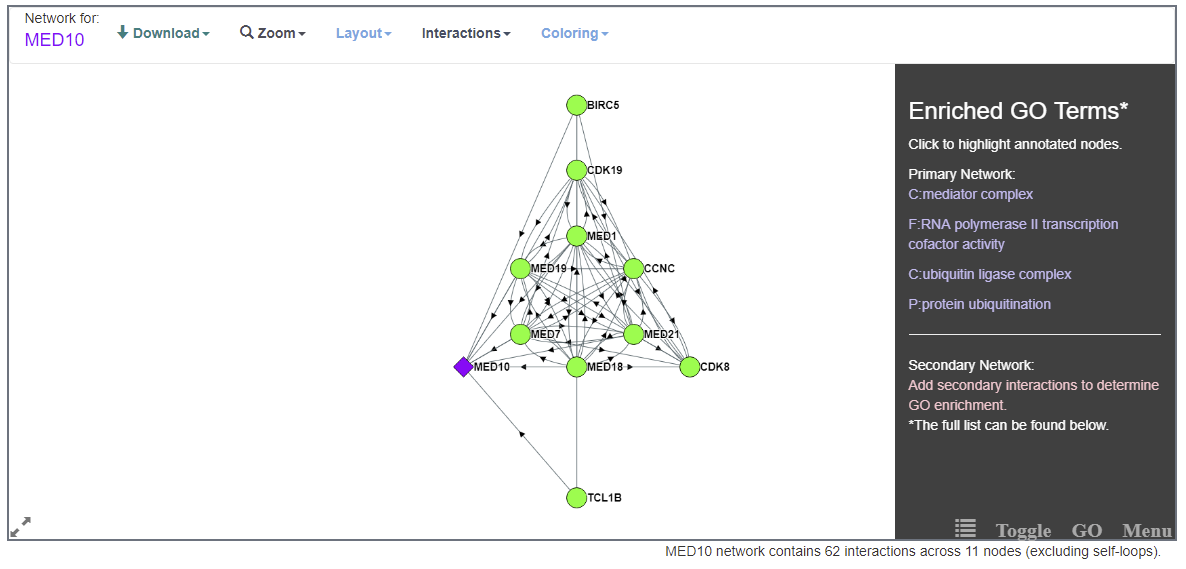
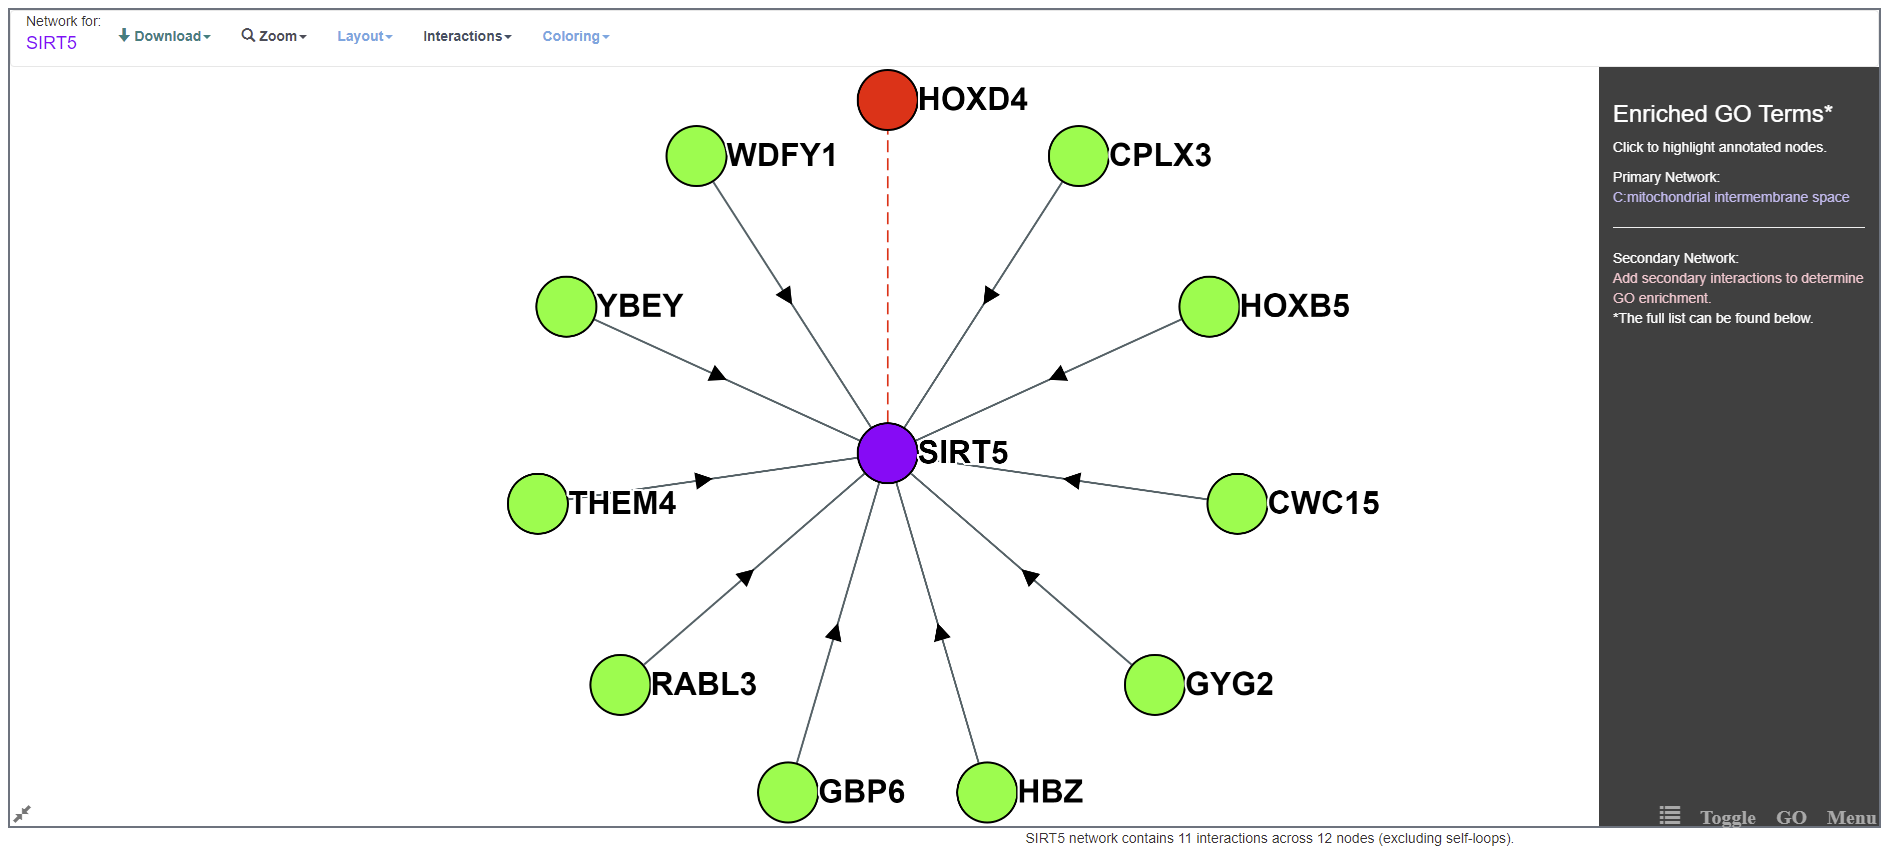
Core Network Display
For display purposes the "core network" or "core sub-network" refer to the protein-of-interest (selected on the home page search) and any other protein observed in a direct interaction with said protein-of-interest.The below network shows the MED10 Core Network:
Interactions
This dropdown menu allows users to add, select and remove nodes according to several criteria.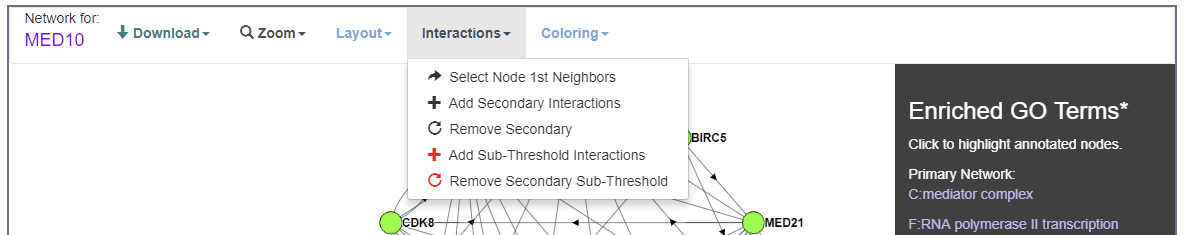
First Neighbor Interactions
Users can use this feature to select all first neighbor nodes for a protein of interest. This feature can help to identify proteins interactions of interest in large networks (e.g. secondary networks or community networks).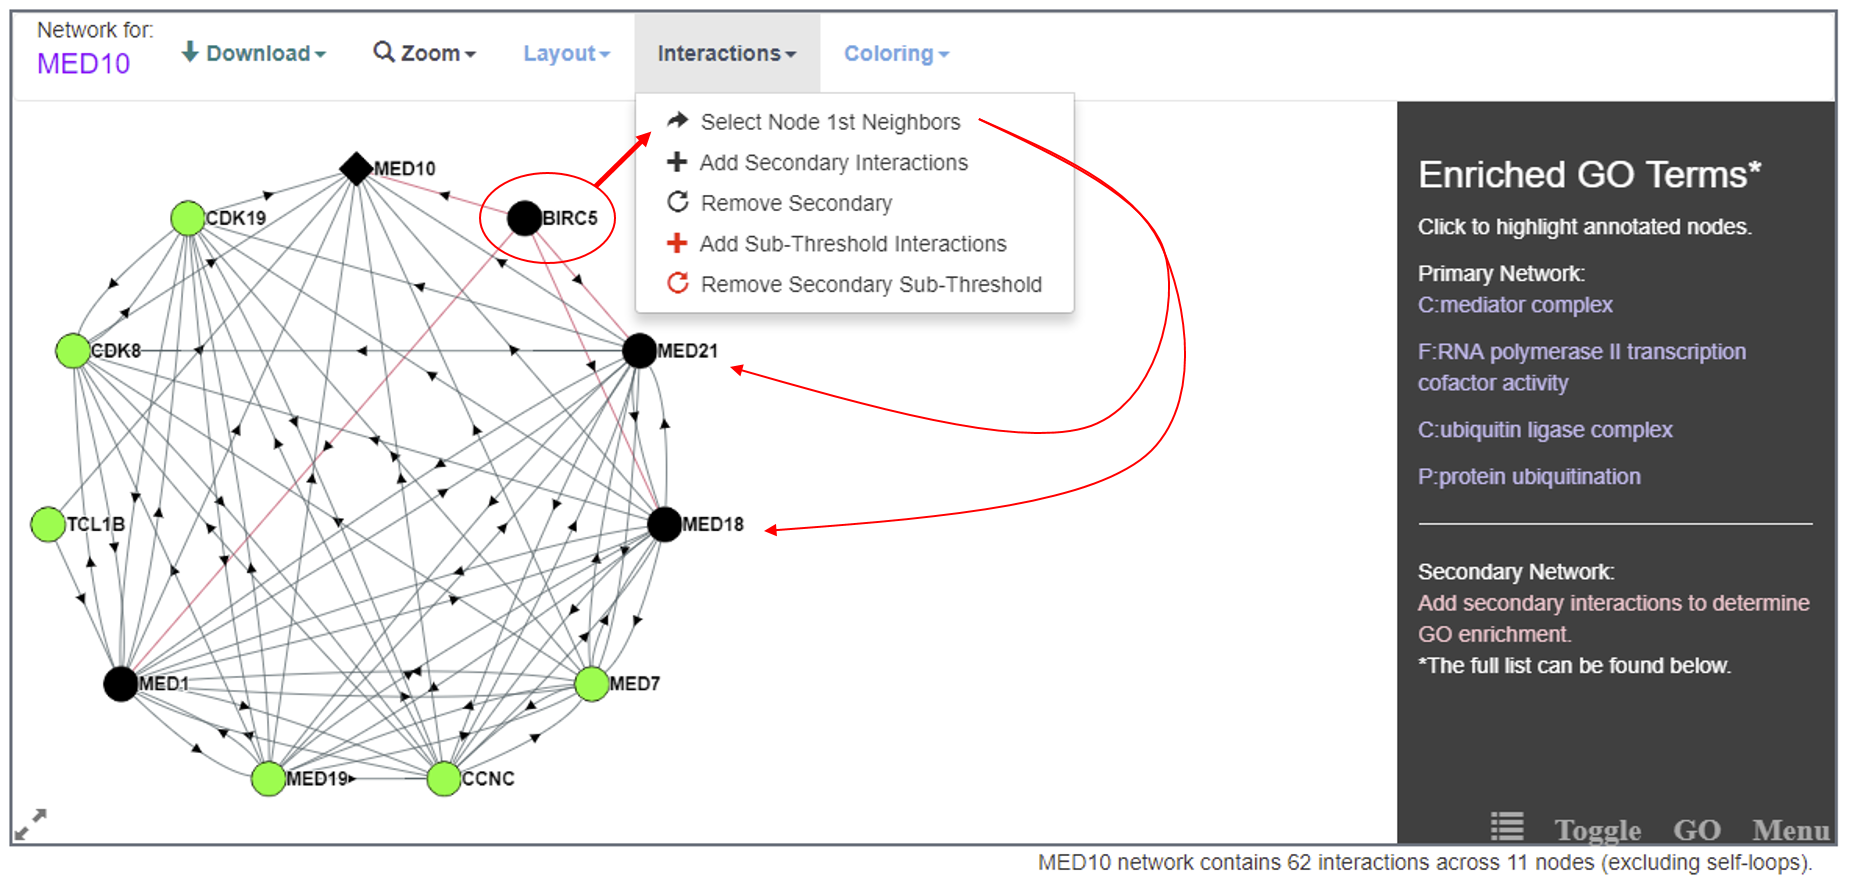
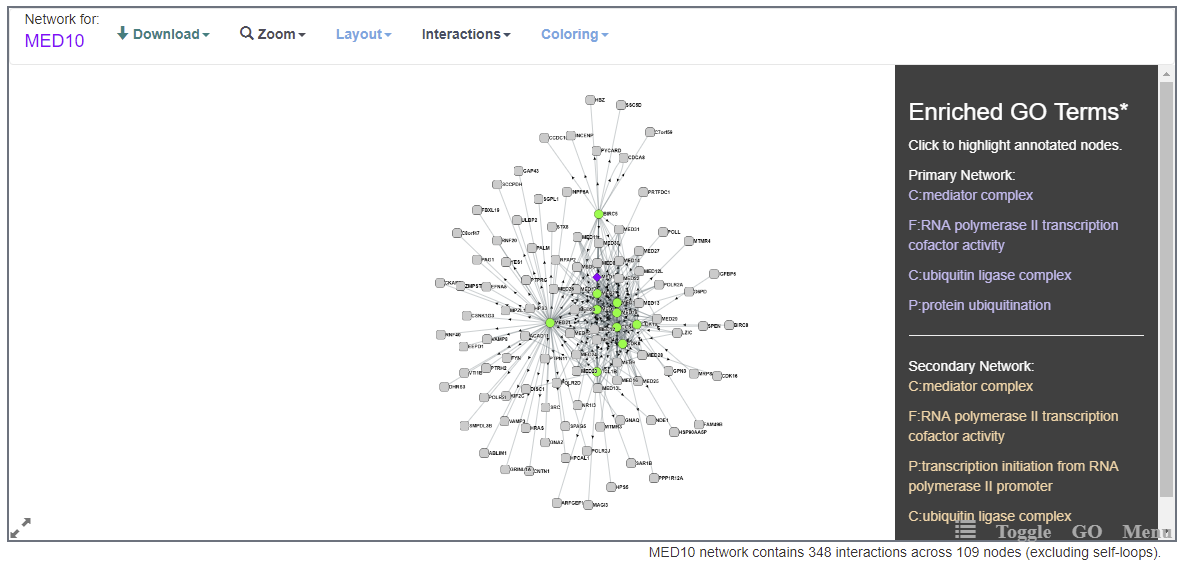
Secondary Interactions
For each core sub-network, users can add secondary interactions. These secondary proteins do no directly interact with the original protein of interest, but interact with the original protein's interactors.Additionally, adding Secondary Interactions will update the Gene Ontoogy Enrichment table.
Sub-threshold Interactions
Users can add a subset of AP-MS identified interactions that fall below the threshold (probability of interaction = 0.75) necessary to be considered an true interaction in the BioPlex dataset.Important these interactions are NOT part of the final, statistically-filtered BioPlex interactome and should not be viewed or used as such.
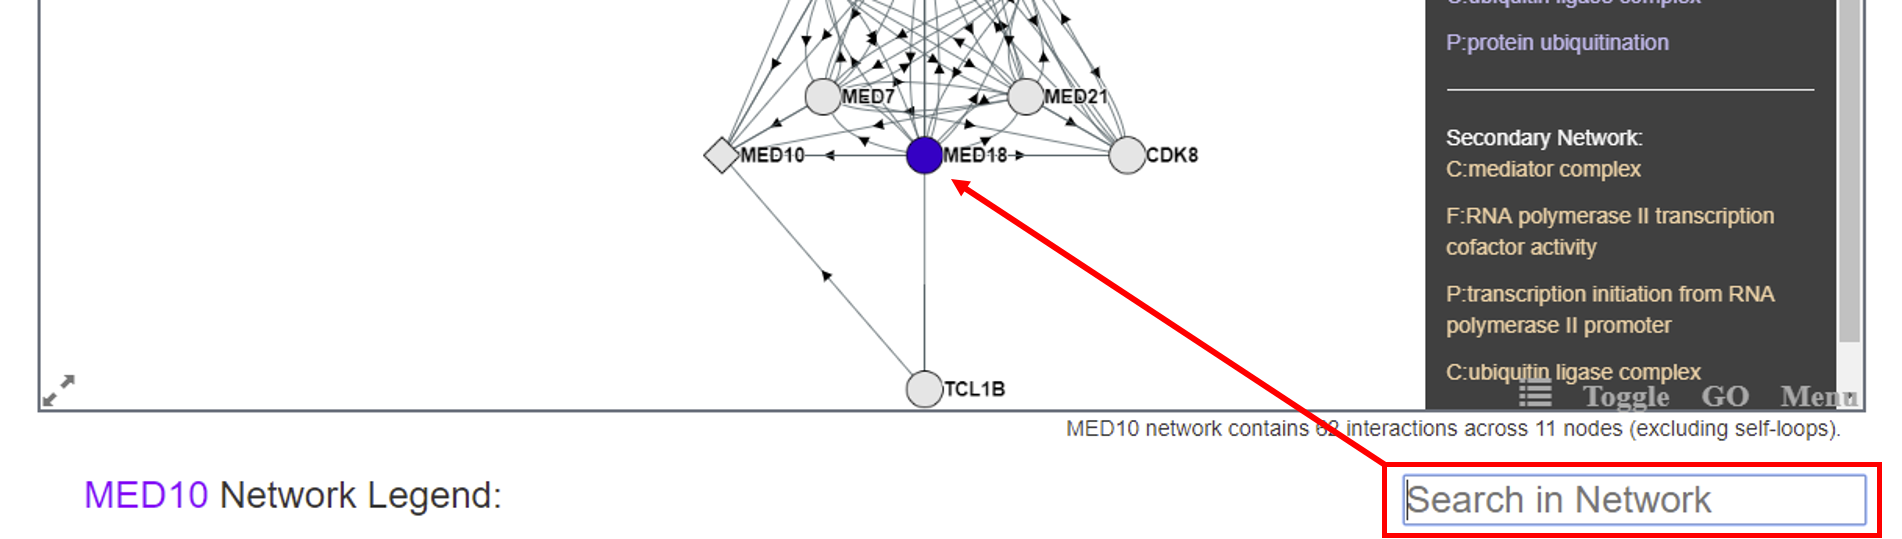
Network Search
Within either the core or secondary networks individual proteins can be highlighted in the "Search in Network" input bar.This search bar will accept and try to match protein symbols, gene ID numbers, and Uniprot Accession numbers. If the requisite node exists in the network it will be highlighted.
Layouts
Each network graph can be displayed using a number of different layouts (e.g. grid, spring embedded, circular).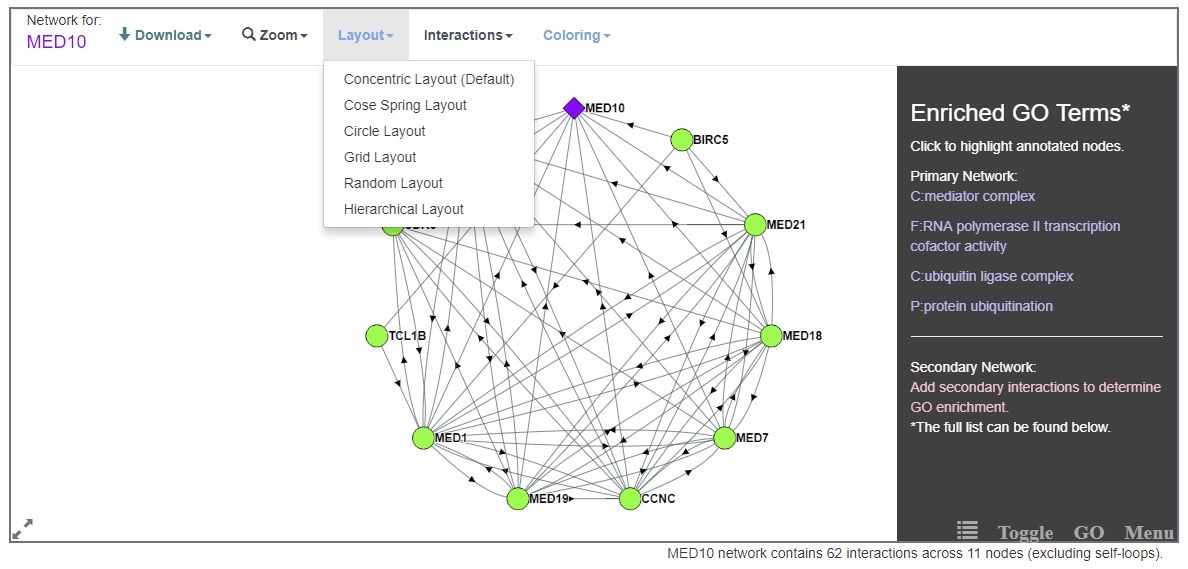
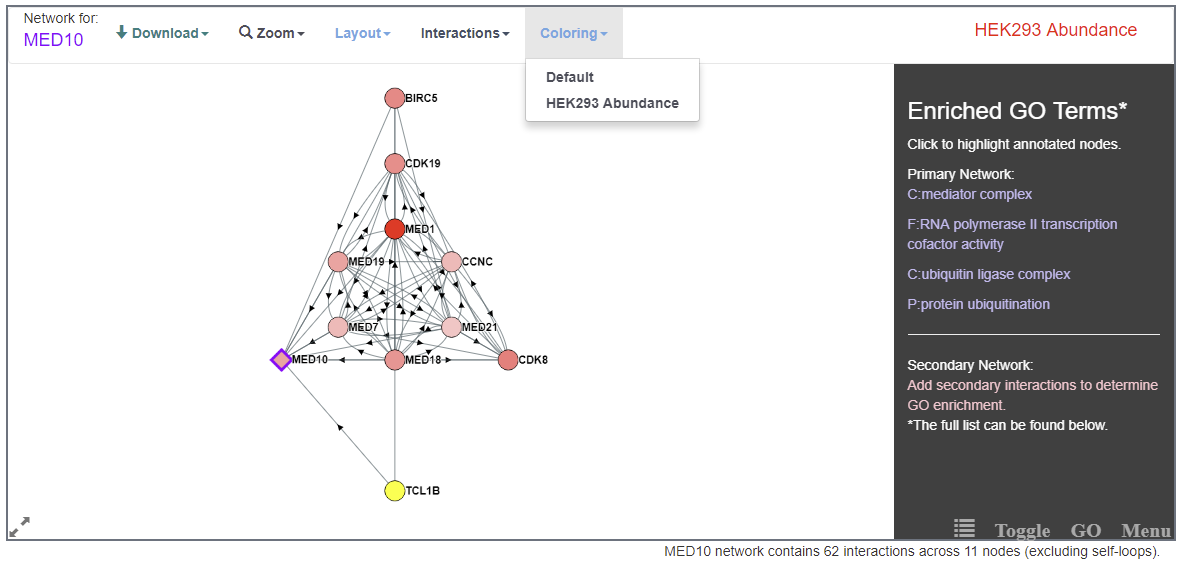
Coloring
Each network can be recolored based on protein attributes. Currently, this includes coloring nodes by their abundance in HEK293 cells, and by their GO/PFAM annotations. To color by HEK293 abundance, click the "Coloring" dropdown menu above the network and select "HEK293 Coloring".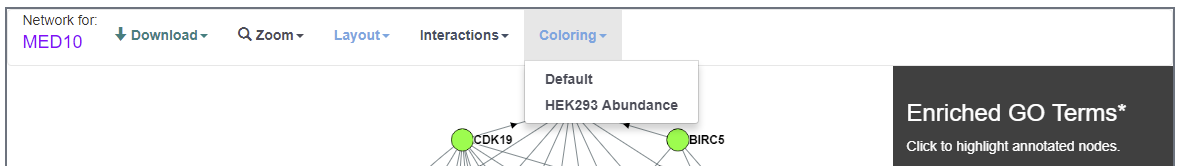
HEK293 Abundance:
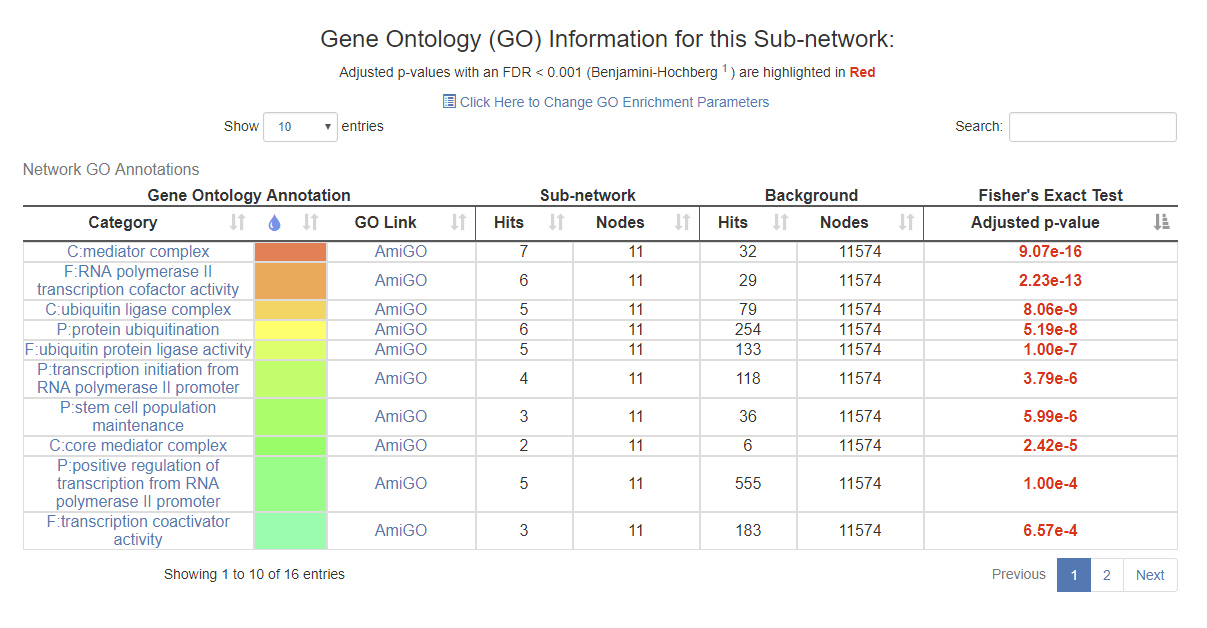
GO Annotation Enrichment
Each sub-network within the Bioplex network is automatically tested for Gene Ontology (GO) enrichment based on the Fisher's Exact Test, adjusted based on the Benjamini-Hochberg FDR. Annotations with an FDR less than 0.001 are highlighted in the GO Annotation Table and the top 4 GO annotations from each network that pass the 0.001 FDR threshold are displayed next to each graph.We note that all GO Enrichments (both primary and secondary networks) are calculated based on the proteins in a network with a probability of interaction greater than or equal to 0.75.
GO Annotation Coloring
By clicking on enriched GO annotation, the proteins associated with the GO term will be highlighted and the highlighed annotation name will be overlaid on the network.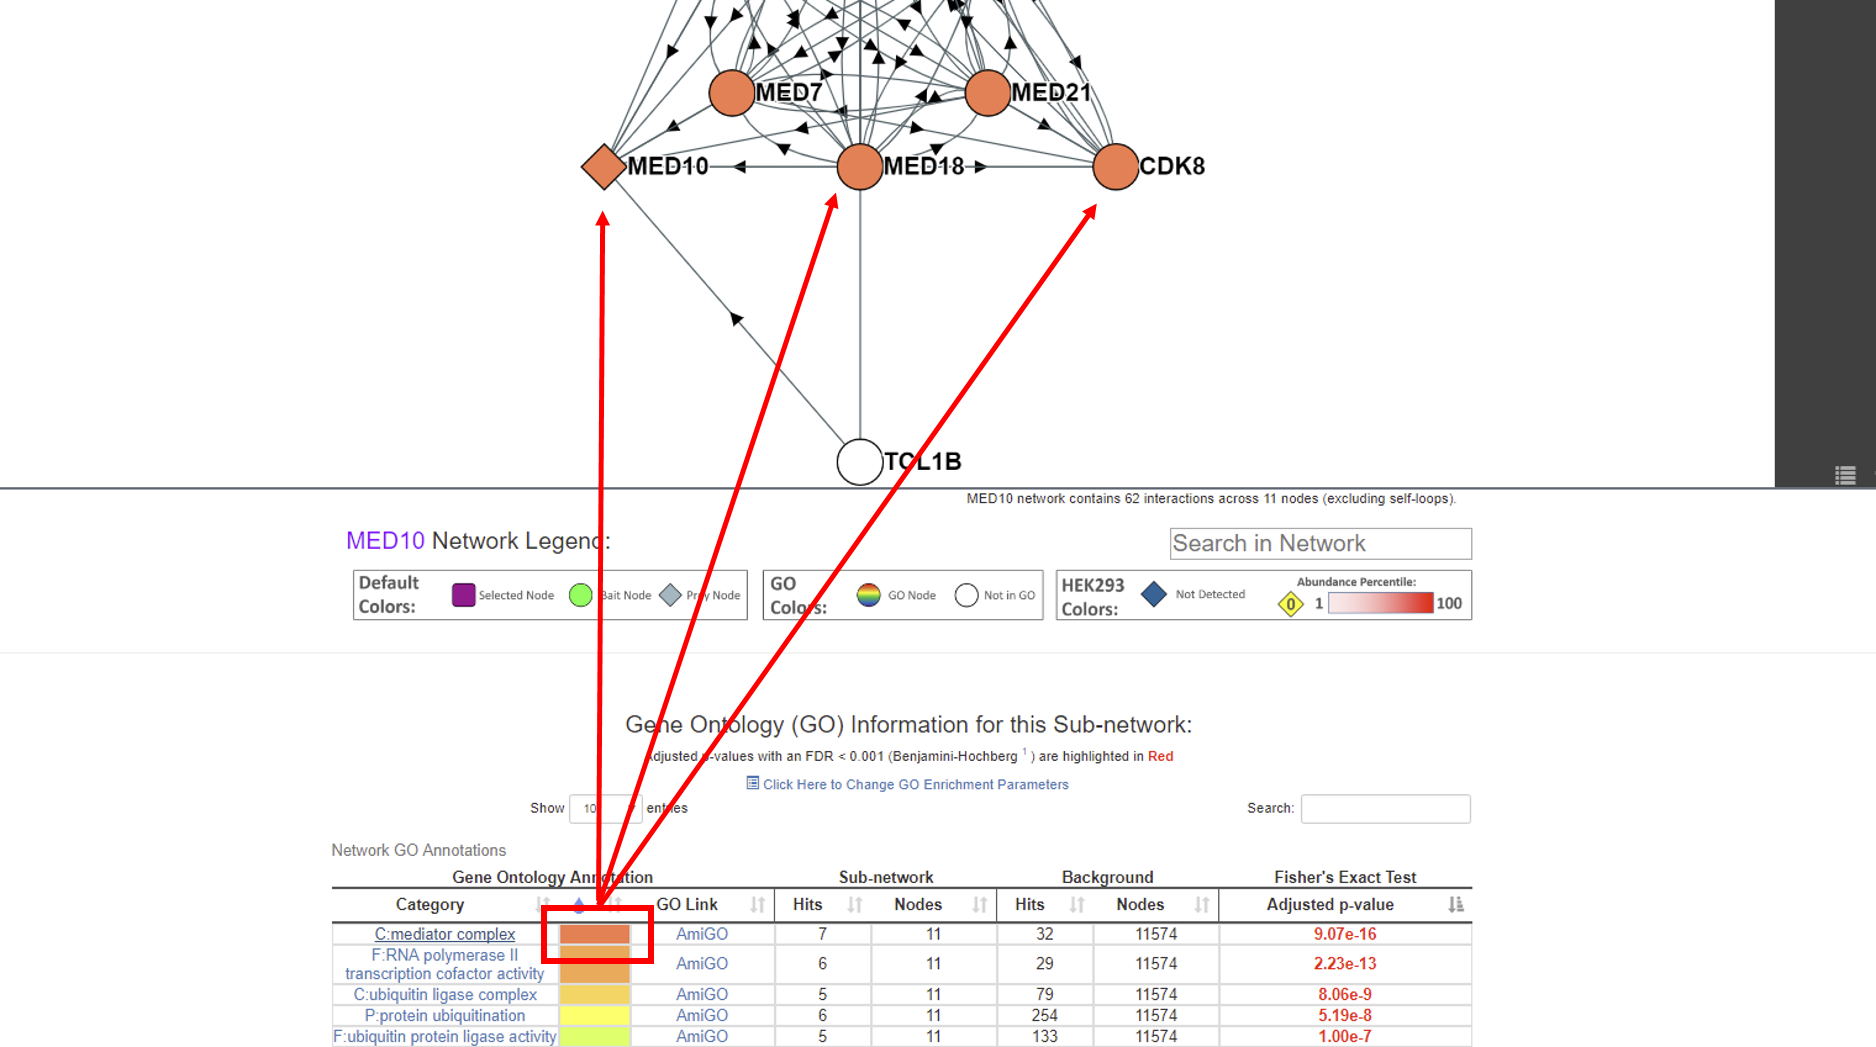
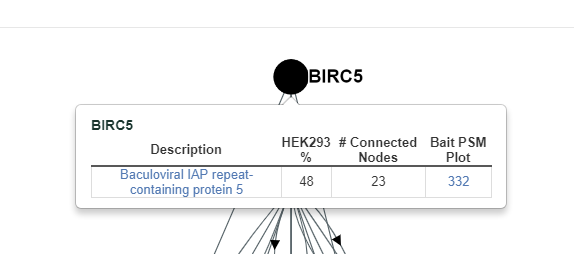
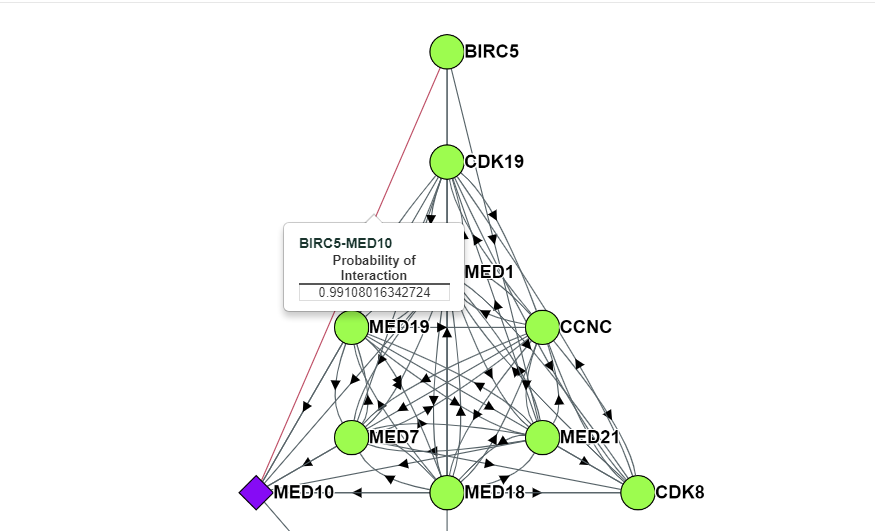
Node and Edge Information
More information for both the nodes and the edges can be obtained by clicking on either the node or edge. This includes links to Uniprot references for each protein and the probability of interaction for each edge.Node:
Edge:
Zoom
The viewport can be adjusted by zooming to fit or zooming to the selected nodes.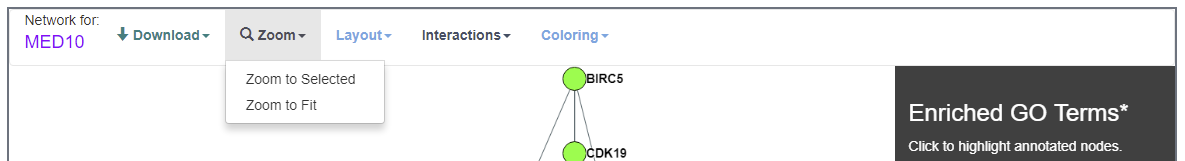
Interaction Table
Node information from the core network can be found in the node table at the bottom of each page. Clicking the protein symbol will highlight the protein within the network. Clicking the Uniprot Accessions links out the Uniprot.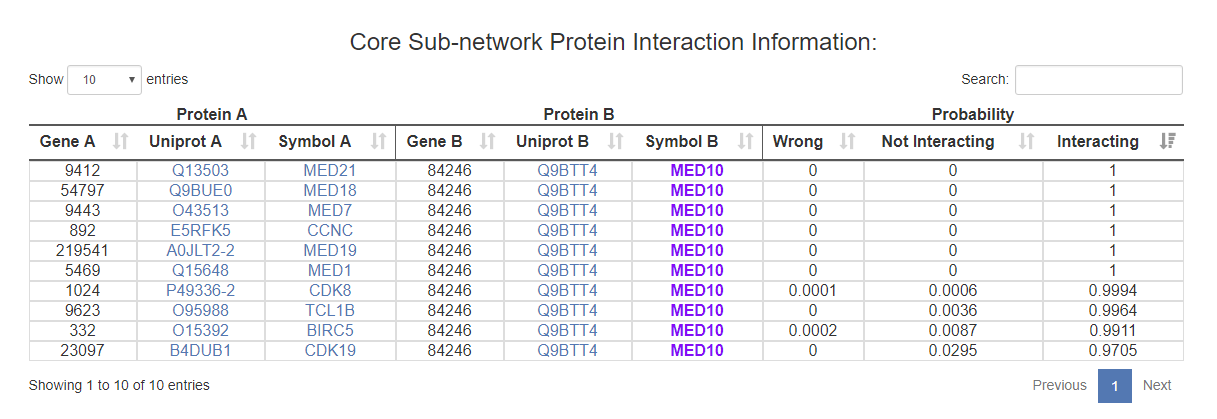
Export Data
Networks can be exported as either a flat text file containing all interaction information for the sub-network, a PNG displaying the network (either the original image or the current one), or as a JSON file that can be directly imported into Cytoscape to further explore the data.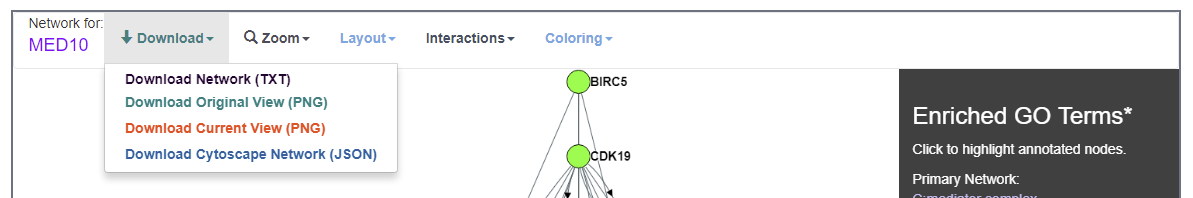
PLEASE NOTE:
Very large networks can cause the PNG image export to fail. If your download does not succeed at first, please try to reduce the size of the network canvas (bottom left corner).
Copyright and License Information
The BioPlex Display website was developed and is licensed under the Creative Commons Attribution-ShareAlike 4.0 International License.Images presented and generated on the the BioPlex Display site are licensed under the Creative Commons Attribution-ShareAlike 4.0 International License.