Architecture of the human interactome defines protein communities and disease networks:
The proteome can be viewed as constellations of interacting proteins that assemble to form myriad complexes, compartments, and signal transduction pathways that organize individual proteins according to shared biological function. Thus, understanding the interactome – the complete set of human protein-protein interactions and the conditions in which they occur – will be essential to developing a systems-level understanding of the human cell.
Since 2012, we have been profiling protein interactions in human cells via affinity-purification mass spectrometry and systematically analyzing interactions for all accessible human proteins at proteome scale. Leveraging the clones available in the human ORFeome (v. 8.1) developed by Marc Vidal and David Hill at the Dana Farber Cancer Center, we have been expressing C-terminally HA-FLAG-tagged versions of each human protein for immunopurification and LC-MS identification of binding partners. We have then been combining these interaction profiles by the thousands to create a series of models of the human interactome with steadily increasing scale.
While the first, BioPlex 1.0 – HEK293T v1.0, included ~24,000 interactions among 8,000 proteins, BioPlex 2.0 – HEK293T v2.0 expanded coverage to ~57,000 interactions among 11,000 proteins. The most recent, BioPlex 3.0 – HEK293T v3.0 & HCT116 v1.0, includes nearly 120,000 interactions among nearly 15,000 proteins and is the most comprehensive experimentally derived model of the human interactome to date. Because each protein’s network position reflects its subcellular localization, biological function, and disease association, these networks have been powerful tools for study of thousands of uncharacterized proteins. They have also provided myriad insights into interactome modularity and organization.
Please Cite the latest BioPlex papers:
HEK293T (v3.0) & HCT116 (v1.0): Huttlin et. al. bioRxiv (2020)
BioPlex Explorer: Schweppe et. al. JPR (2018)
Previous BioPlex Versions:
HEK293T (v2.0): Huttlin et. al. Nature (2017)
HEK293T (v1.0): Huttlin et. al. Cell (2015)
Contact Information
BioPlex Explorer was developed by Devin K. Schweppe, Edward L. Huttlin, Joao Paulo, J. Wade Harper and Steve P. Gygi.For questions pertaining to the website please email Devin K Schweppe at:
devin_schweppe at hms dot harvard dot edu
(bolded portions should be symbols).
For other comments or questions, please see the Team page for more information.
Explorer Resources
BioPlex Explorer uses a number of resources to build the web application, including:Search for a single protein
Proteins of interest can be searched from the home page by either:- Searching for proteins contained in the Bioplex Network, or
- Selecting proteins from the Bioplex network.
See image below for more information.
Search for multiple proteins
Multiple proteins can be searched at once using comma-delimited strings.Examples
Mitotic Spindle Kinases and Phosphatases: AurkA,Plk1,Pak7,PPP6R2
Mitochondrial Respiratory Complex I: NDUFA1,NDUFA2,NDUFS3,NDUFA5,NDUFS6,NDUFA13,NDUFS6,NDUFB11
14-3-3 Proteins: YWHAB,YWHAE,YWHAG,YWHAH,YWHAQ,YWHAZ,CGN,CDC25A,SPATA13,EPB49,STAC
External Queries of Protein Interactions Networks
Proteins of interest can also be queries externally using the following link:bioplex.hms.harvard.edu/explorer/externalQuery.php?geneQuery=<geneID>
Where <geneID> should be a gene ID number for the protein of interest.Examples:
Bin3: bioplex.hms.harvard.edu/explorer/externalQuery.php?geneQuery=55909
EGFR: bioplex.hms.harvard.edu/explorer/externalQuery.php?geneQuery=1956
Access data through the BioPlex API
Interactions can be queried through an API for access to the protein-protein interaction data underlying the BioPlex Display site. Data can be exported as either JSON arrays (default) or tab-seperated flat files (.txt).The API will not export queries larger than 10000 rows. If you need the full dataset, please download that here.
Potential query parameters:
geneQuery - Query all interactions involving a specific geneID.pintLow - Low probability of interaction filter. Interactions with probability of interaction greater than or equal to this value will be extracted.
pintHigh - High probability of interaction filter. Interactions with probability of interaction less than or equal to this value will be extracted.
interaction - Query BioPlex for a specific interaction (geneID-geneID).
Examples:
Bin3 Interactions (JSON Array):
https://bioplex.hms.harvard.edu/explorer/api/api.php?geneQuery=55909
Bin3 Interactions (TXT):
https://bioplex.hms.harvard.edu/explorer/api/api.php?geneQuery=55909&json=0
EGFR Interactions (JSON Array):
https://bioplex.hms.harvard.edu/explorer/api/api.php?geneQuery=1956
EGFR Interactions (0.9 < pInt < 1, JSON Array):
https://bioplex.hms.harvard.edu/explorer/api/api.php?geneQuery=1956&pintLow=0.9&pintHigh=1
EGFR-PTPRK Interaction (JSON Array):
https://bioplex.hms.harvard.edu/explorer/api/api.php?interaction=1956-5796
Network Toolbar
BioPlex sub-networks are displayed using Cytoscape.js. Within each display there are multiple options for exploring the BioPlex interactions with your protein interest. Nodes can be selected using CTRL+click-and-drag.- Core Network Display
- Interactions
- Network Search
- Context Menu
- Coloring
- GO Annotation Enrichment
- GO Annotation Coloring
- Node and Edge Info.
- Export Data
- Interaction Table
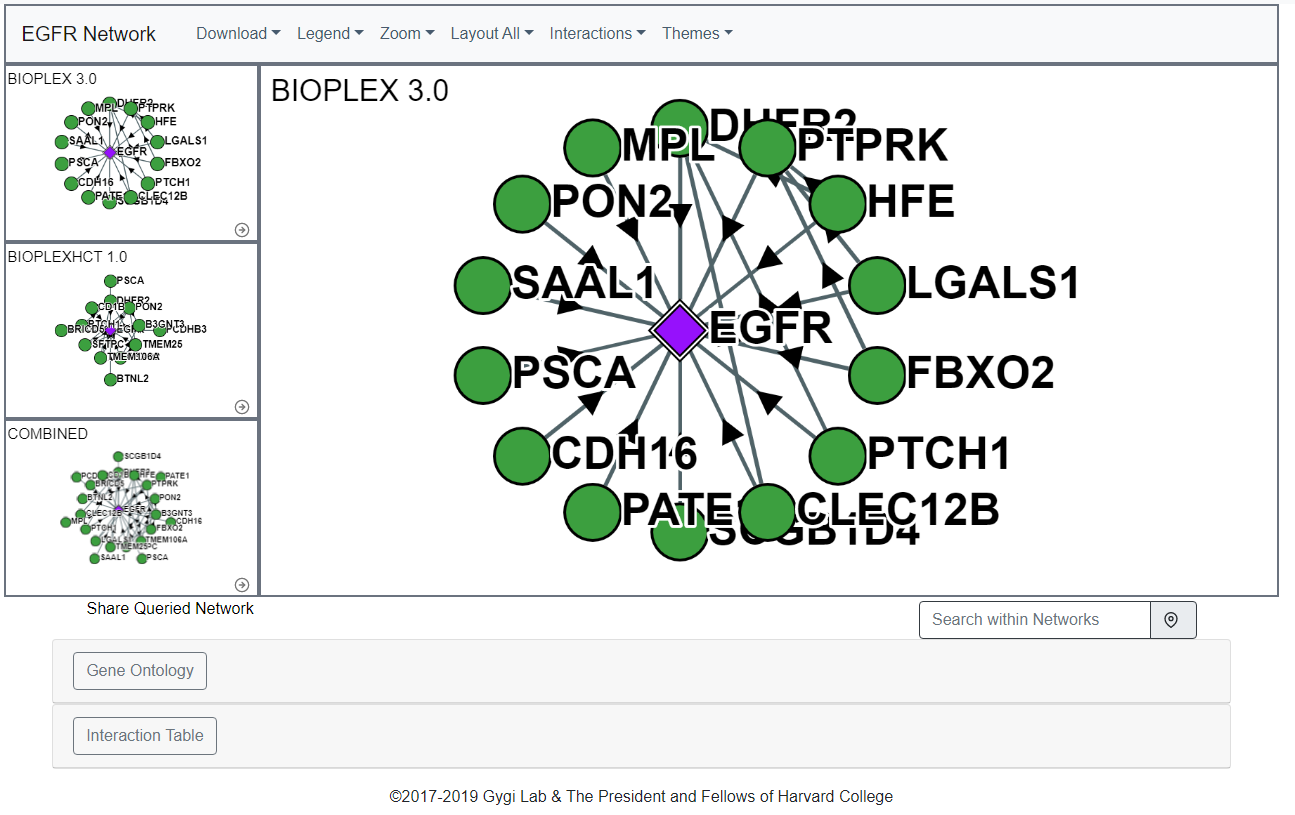
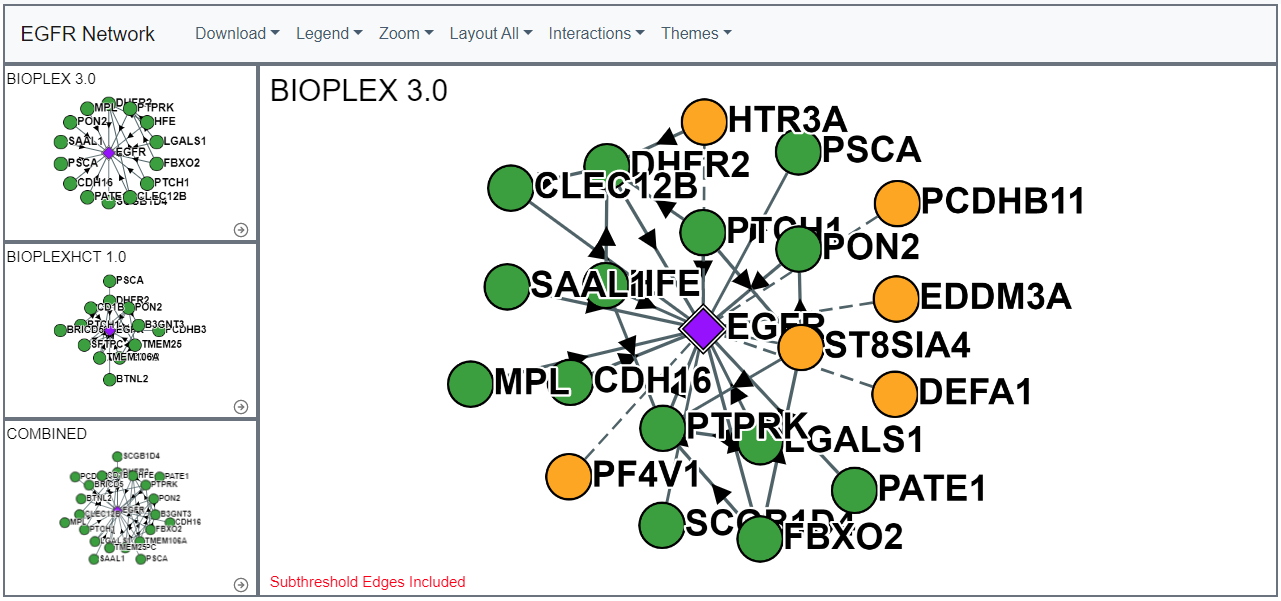
Core Network Display
For display purposes the "core network" or "core sub-network" refer to the protein-of-interest (selected on the home page search) and any other protein observed in a direct interaction with said protein-of-interest.The below network shows the EGFR Core Network:
Interactions
This dropdown menu allows users to add, select and remove nodes according to several criteria.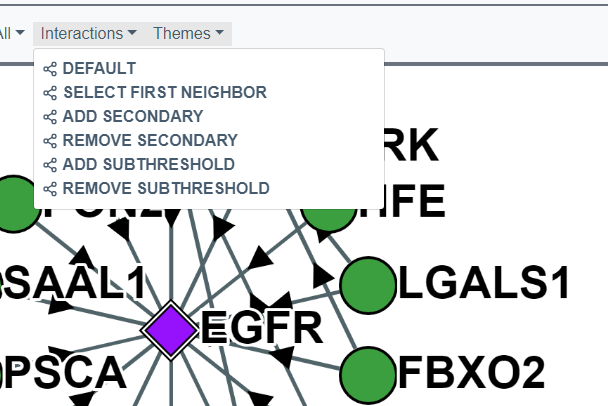
First Neighbor Interactions
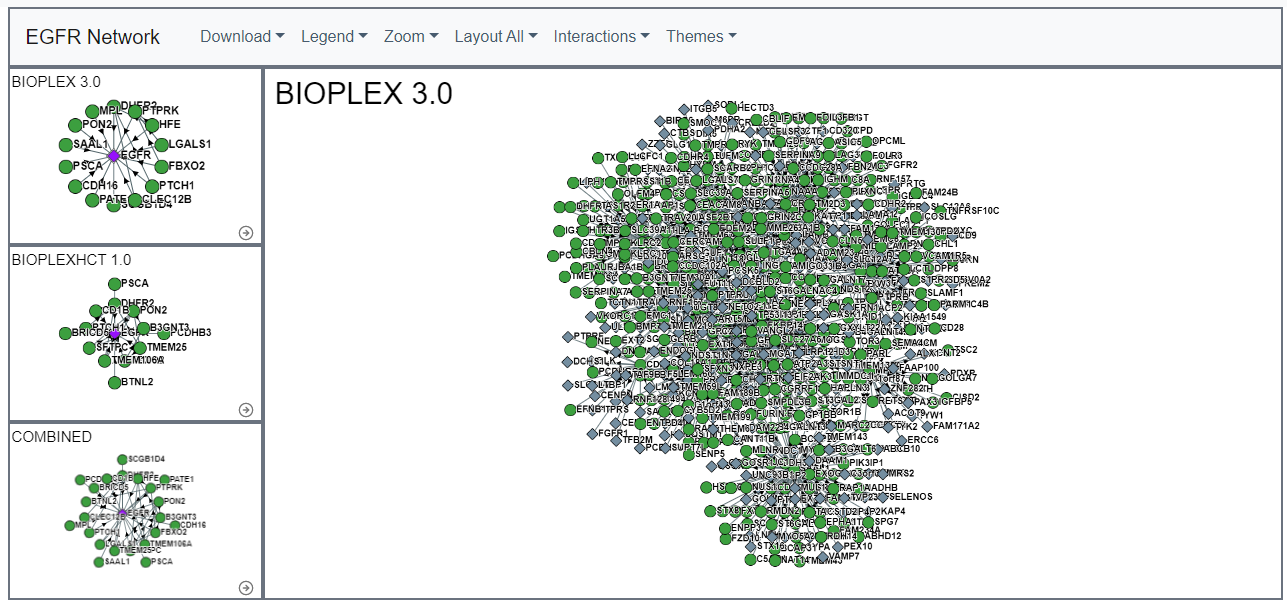
Users can use this feature to select all first neighbor nodes for a protein of interest. This feature can help to identify proteins interactions of interest in large networks (e.g. secondary networks or community networks).Secondary Interactions
For each core sub-network, users can add secondary interactions. These secondary proteins do no directly interact with the original protein of interest, but interact with the original protein's interactors.Additionally, adding Secondary Interactions will update the Gene Ontoogy Enrichment table.
Sub-threshold Interactions
Users can add a subset of AP-MS identified interactions that fall below the threshold (probability of interaction = 0.75) necessary to be considered an true interaction in the BioPlex dataset.Important these interactions are NOT part of the final, statistically-filtered BioPlex interactome and should not be viewed or used as such.
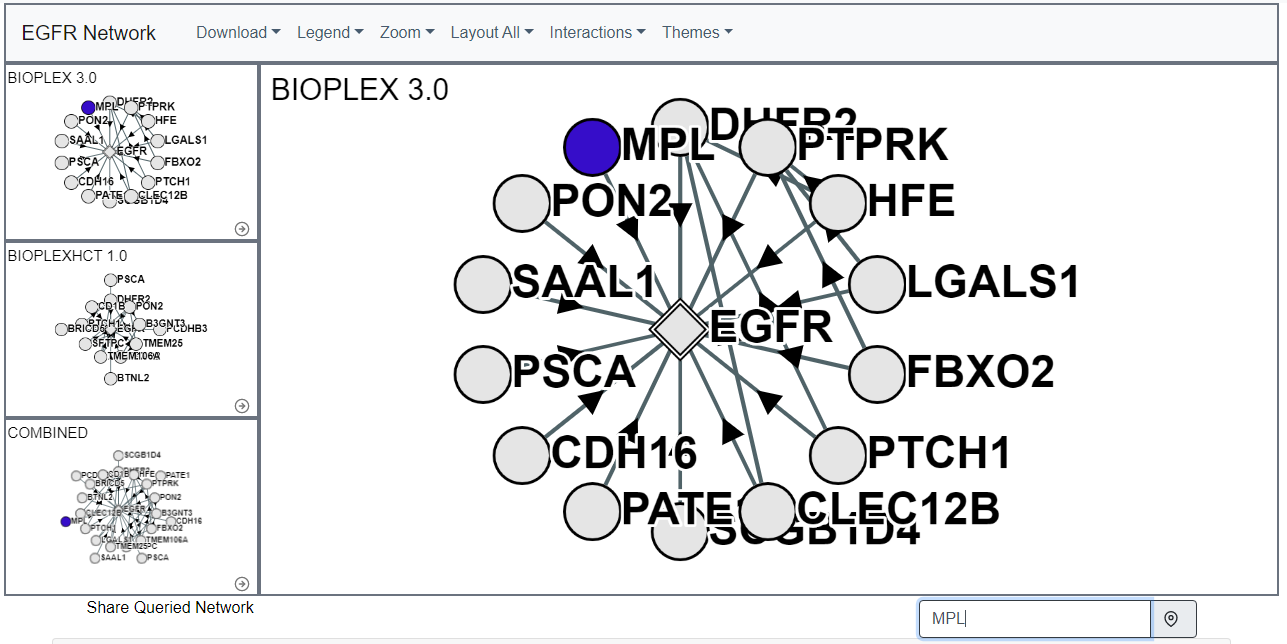
Network Search
Within either the core or secondary networks individual proteins can be highlighted in the "Search in Network" input bar.This search bar will accept and try to match protein symbols, gene ID numbers, and Uniprot Accession numbers. If the requisite node exists in the network it will be highlighted.
Context Menu
By right-clicking within the network pane, a context menu can be deployed to update coloring, zooming or the network layout for individual networks. Right clicking on a node will also allow you to remove specific nodes.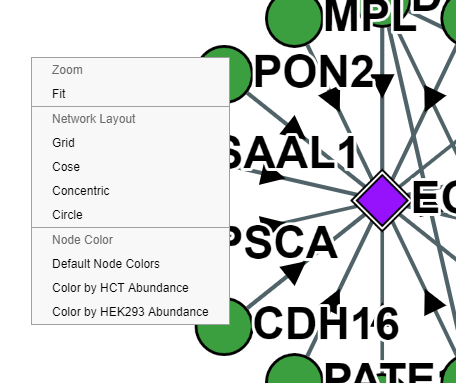
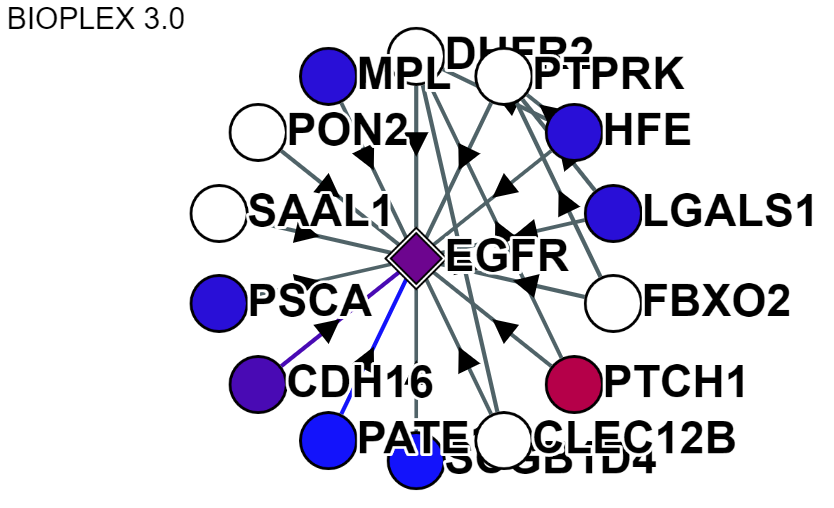
Coloring
Each network can be recolored based on protein attributes. Currently, this includes coloring nodes by their abundance in HEK293 cells, Gene Age and by their GO/PFAM annotations. To color by HEK293 abundance, click the "Theme" dropdown menu above the network and select "HEK293 Coloring".Gene and Interaction Age: as estimated by Liebeskind et al. (2016, Gen Bio Evo)
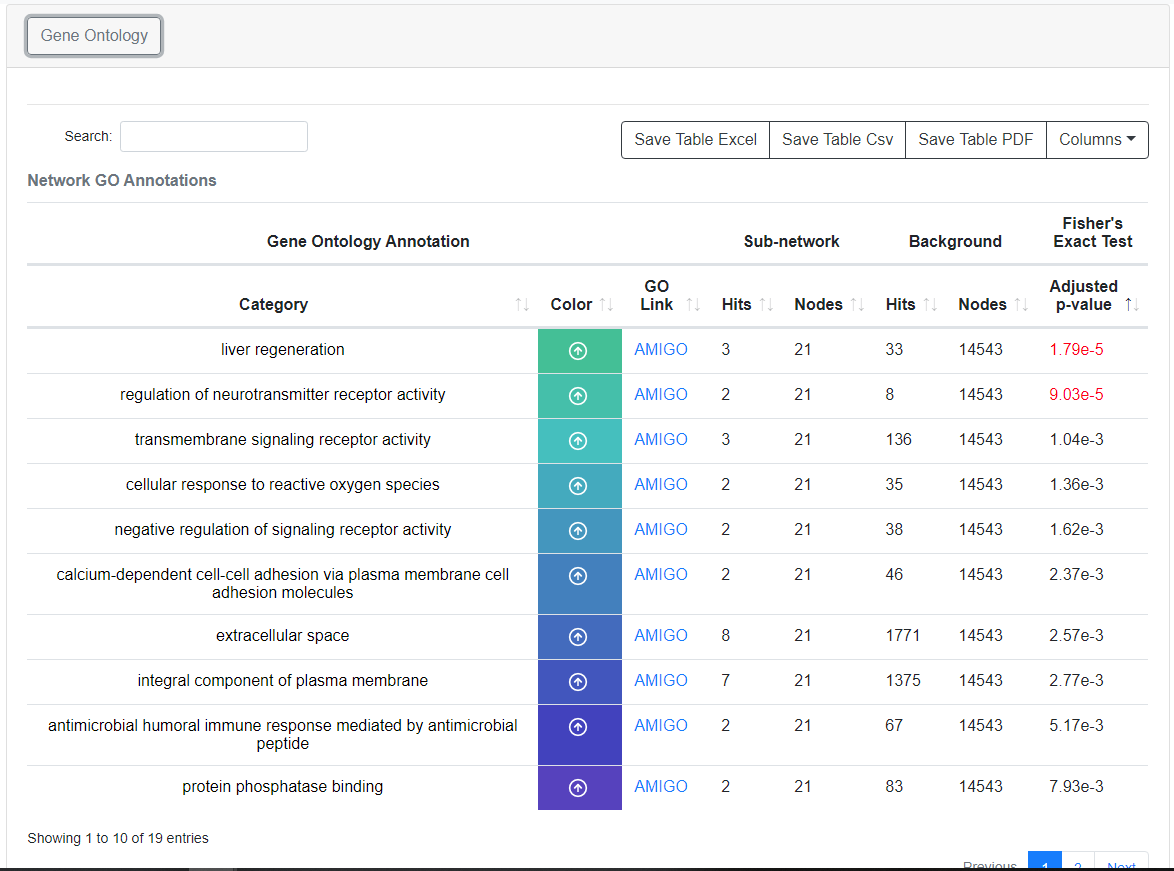
GO Annotation Enrichment
Each sub-network within the Bioplex network is automatically tested for Gene Ontology (GO) enrichment based on the Fisher's Exact Test, adjusted based on the Benjamini-Hochberg FDR. Annotations with an FDR less than 0.001 are highlighted in the GO Annotation Table and the top 4 GO annotations from each network that pass the 0.001 FDR threshold are displayed next to each graph.We note that all GO Enrichments (both primary and secondary networks) are calculated based on the proteins in a network with a probability of interaction greater than or equal to 0.75.
GO Annotation Coloring
By clicking on enriched GO annotation, the proteins associated with the GO term will be highlighted and the highlighed annotation name will be overlaid on the network.
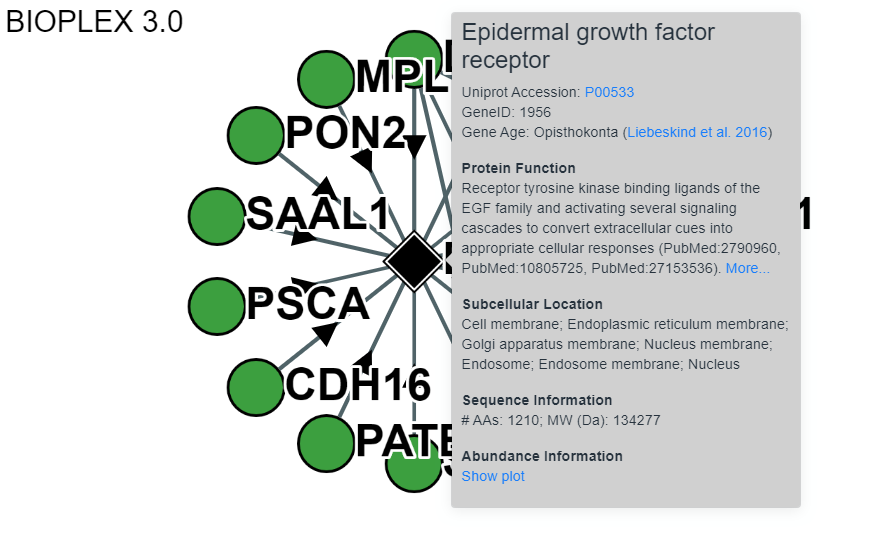
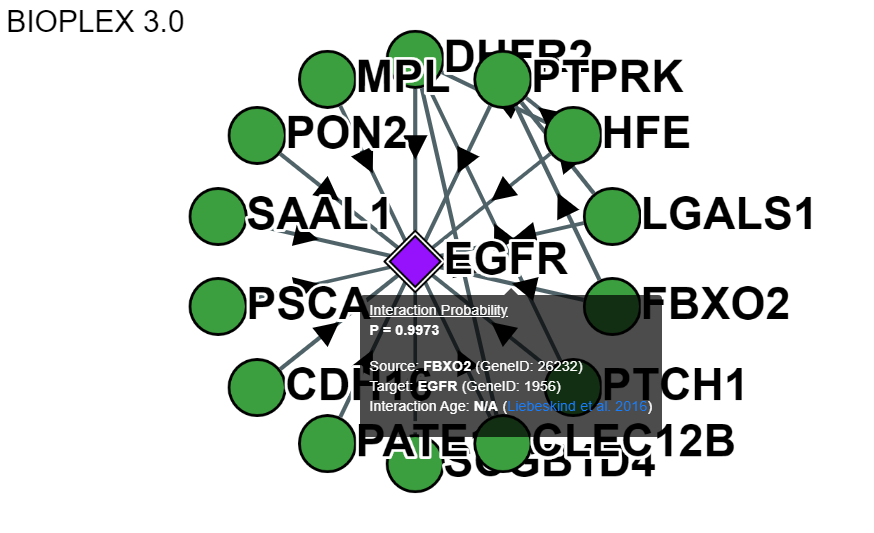
Node and Edge Information
More information for both the nodes and the edges can be obtained by clicking on either the node or edge. This includes links to Uniprot references for each protein and the probability of interaction for each edge.Node:
Edge:
Interaction Table
Node information from the core network can be found in the node table at the bottom of each page. Clicking the protein symbol will highlight the protein within the network. Clicking the Uniprot Accessions links out the Uniprot.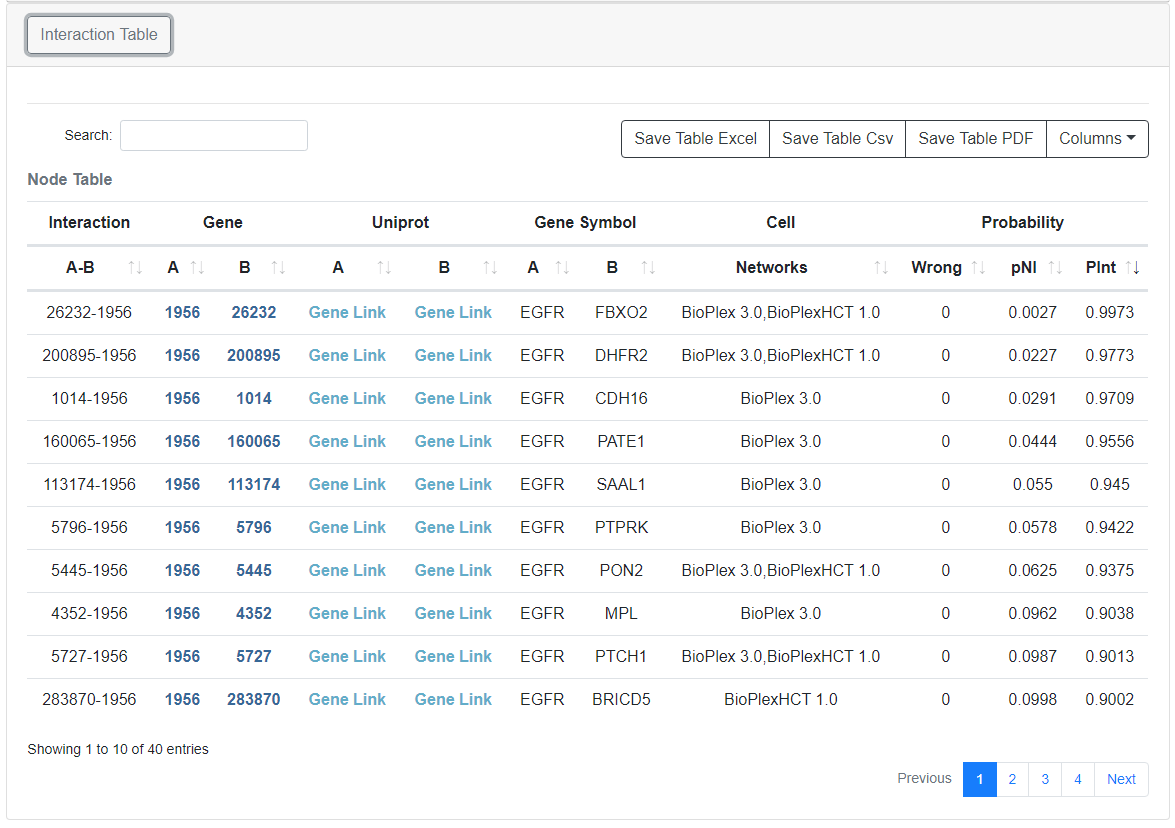
Export Data
Networks can be exported as either a flat text file containing all interaction information for the sub-network, a PNG displaying the network (either the original image or the current one), or as a JSON file that can be directly imported into Cytoscape to further explore the data.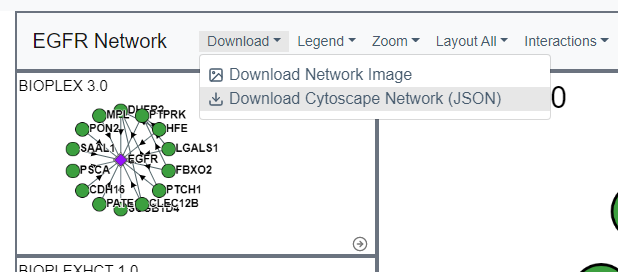
PLEASE NOTE:
Very large networks can cause the PNG image export to fail. If your download does not succeed at first, please try to reduce the size of the network canvas (bottom left corner).
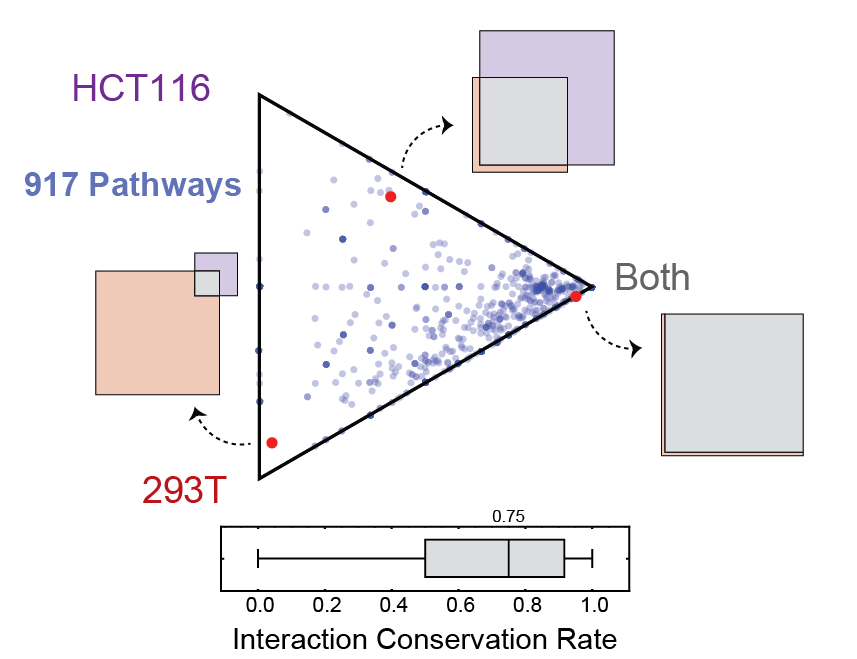
Cell Line Interactome Conservation
Ternary diagram depicting the proportions of edges shared or unique to either 293T or HCT116 cells for subnetworks defined by each of 917 Reactome pathways. Proteins in each pathway were mapped to the combined 293T/HCT116 network to define a subnetwork whose edges were shared or unique to either cell line.Points near the corners indicate that most edges are either shared ('Both') or cell-specific; points near the center of the triangle indicate edges evenly distributed across shared and cell-specific categories. The ternary diagram thus summarizes Venn diagrams for 917 pathways. A box-whisker plot depicts the edge overlap across pathways.
This page corresponds to Figure 3 and Figure S5 from the preprint BioPlex Manuscript.
Conservation page
The Cell Line Conservation page is fully interactive and links directly to the network display page for easy, intuitive interrogation of the combined interactomes.
Cell Line Interactome Conservation
The 293T and HCT116 networks were combined and partitioned via MCL clustering to identify 1,423 network communities with 3+ members. Interactions among communities were then tallied to identify 1,736 statistically enriched associations. Interaction overlap across cell types was then tallied within each community and along edges that connect associated community pairs.Network of communities detected in the combined 293T/HCT116 interaction network. Every network community with at least 3 members is represented as a node whose size is proportional to the number of proteins it contains. Edges connect communities that were statistically associated. Nodes and colors reflect the level of overlap among cell lines.
Communities page
This page corresponds to Figure 4 from the preprint BioPlex Manuscript.
Domain-Domain Interaction Landscape.
PFAM domains were mapped to all proteins in the combined HCT116/293T network. Domain pairs connected by unusually high numbers of edges were then identified. The overlap of edges connecting each statistically associated domain pair was then determined across cell lines. These domain-domain associations are depicted as a network with edge colors that reflect sharing of interactions across cell lines.Domains page
This page corresponds to Figure 5 from the preprint BioPlex Manuscript.
BioPlex and Achilles: Linking Physical and Functional Associations for Biological Discovery
For each pair of interacting proteins in the combined 293T/HCT116 interaction network, cellular fitness profiles from Project Achilles were correlated and assessed for statistical significance. Following multiple testing correction, edges with either positive or negative cellular fitness correlations were extracted and assigned as either shared or cell-specific. Only edges detectable in both cell lines are shown.Fitness page
This page corresponds to Figure 7 from the preprint BioPlex Manuscript.
Copyright and License Information
The BioPlex Display website was developed and is licensed under the Creative Commons Attribution-ShareAlike 4.0 International License.Images presented and generated on the the BioPlex Display site are licensed under the Creative Commons Attribution-ShareAlike 4.0 International License.
©2016-20 Gygi Lab & The President and Fellows of Harvard College